

안녕하세요, 쉽지 않은 길에 들어선 짐민입니다.
사이킷런을 이용해서 먼저 가벼운 비지도학습을 해보기 위한 기능들을 알아보겠습니다.
# 첫 예제

import pandas as pd
import numpy as np
import sklearn
from sklearn.datasets import load_iris
from sklearn.tree import DecisionTreeClassifier
from sklearn.model_selection import train_test_split
from sklearn.metrics import accuracy_score

iris = load_iris()

iris_data = iris.data

iris_label = iris.target
# print('iris target값:', iris_label)
# print('iris target명:', iris.target_names)

iris_df = pd.DataFrame(data=iris_data, columns=iris.feature_names)
iris_df['label'] = iris.target
iris_df.head()

x_train, x_test, y_train, y_test = train_test_split(iris_data, iris_label, test_size=0.2, random_state=112)

dt_clf = DecisionTreeClassifier(random_state=1154)
dt_clf.fit(x_train, y_train)

pred = dt_clf.predict(x_test)

print('예측 정확도: {0:.4f}'.format(accuracy_score(y_test, pred)))
target으로 레이블값을 불러올 수 있고,
DecisionTreeClassifier()으로 결정 트리 분류를 할 수 있습니다.
train_test_split으로 학습 데이터와 테스트 데이터를 나눌 수 있습니다.
이 예제에서는 결정트리를 사용하여 fit()과 predict()를 하였습니다.
fit 함수에 데이터와 레이블 값을 넣어주면 된다고 합니다.
random_state는 테스트값이 일정하게 나오게 유지하기 위해 넣었습니다.
원래는 일정하면 오히려 학습에 안 좋을 수 있기 때문에 안 넣는 게 나을지도 모르겠습니다.
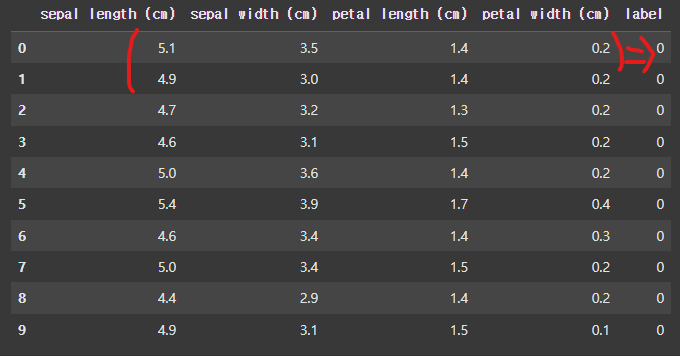
이렇게 옆의 데이터가 있으면 학습해서 레이블 값을 유추해내는 것입니다.
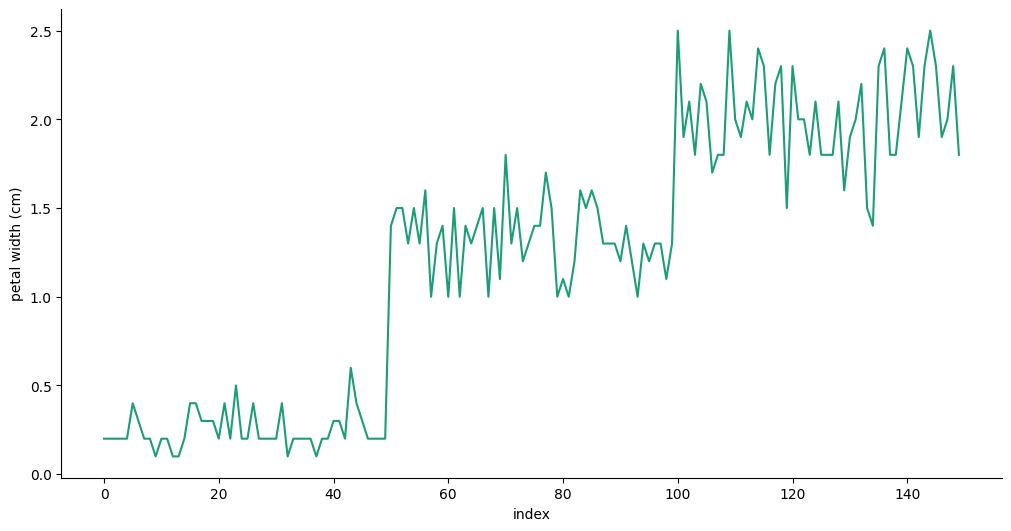
matplotlib, seaborn으로 만들어진 그래프입니다. (colab이 만들어줌)
K-Fold 교차 검증

학습이 잘 되었더라도, 특정 테스트 데이터에만 잘 맞는 오버피팅이 발생할 수 있습니다.
이를 방지하기 위하여 교차 검증이 필요합니다.
K-Fold 교차 검증 방식은 학습 데이터도 또 나눠서 학습/검증 데이터로 나누어서 학습-검증을 진행,
이 단계를 여러 번 해서 알고리즘의 적합성을 판단하는 방식입니다.
분류 알고리즘에서는 Stratified K 폴드가 적합합니다.
Stratified는 데이터가 특정 위치에 몰려있는 걸 방지하기 위해 사용되는 방식입니다.
회귀 알고리즘은 연속된 값들을 다루기 때문에 이 방식은 사용할 수가 없습니다.
아무튼 교차 검증을 해봅시다.
kfold = KFold(n_splits=5)
cv_accuracy = []

print("붓꽃의 데이터 사이즈:", iris_data.shape[0])

for train_index, test_index in kfold.split(iris_data):
  x_train, x_test = iris_data[train_index], iris_data[test_index]
  y_train, y_test = iris_label[train_index], iris_label[test_index]

  dt_clf.fit(x_train, y_train)
  pred = dt_clf.predict(x_test)
  accuracy = np.round(accuracy_score(y_test, pred), 4)

  print("검증 신뢰도:",accuracy,"검증 인덱스", test_index)
  cv_accuracy.append(accuracy)

print('검증 정확도:', np.mean(cv_accuracy))
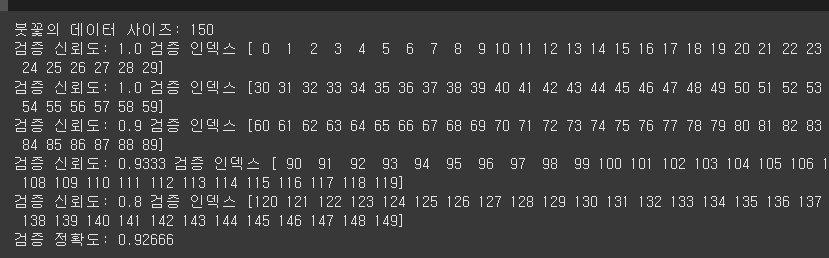
이렇게 0.9 이상의 정확도를 보입니다.
다만 지금 사용하고 있는 붓꽃의 데이터는
0~49 인덱스까지는 Setosa, 50~99까지는 Versicolor, 100~149까지는 Virginica 품종으로
KFold가 3이 될 시 어느 분류는 아예 학습을 할 수 없기 때문에 아예 테스트가 불가능해집니다.
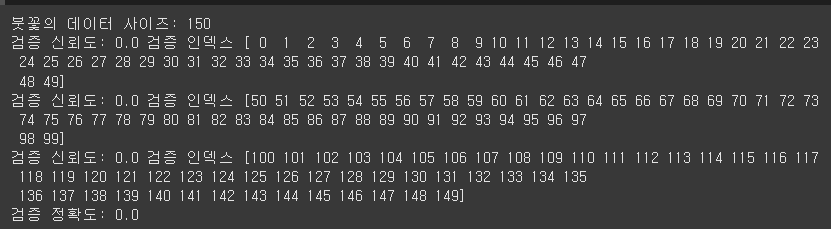
정확도 0.0이 나오네요.
이럴 때 Stratified K-Fold를 사용합니다.
# kfold = KFold(n_splits=3)
skfold =  StratifiedKFold(n_splits=3)
cv_accuracy = []

print("붓꽃의 데이터 사이즈:", iris_data.shape[0])

for train_index, test_index in skfold.split(iris_data, iris_label):
  x_train, x_test = iris_data[train_index], iris_data[test_index]
  y_train, y_test = iris_label[train_index], iris_label[test_index]

  dt_clf.fit(x_train, y_train)
  pred = dt_clf.predict(x_test)
  accuracy = np.round(accuracy_score(y_test, pred), 4)

  print("검증 신뢰도:",accuracy,"검증 인덱스", test_index)
  cv_accuracy.append(accuracy)

print('검증 정확도:', np.mean(cv_accuracy))
StratifiedKFold는 split에 데이터와 레이블 값까지 모두 넣어줘야 합니다.
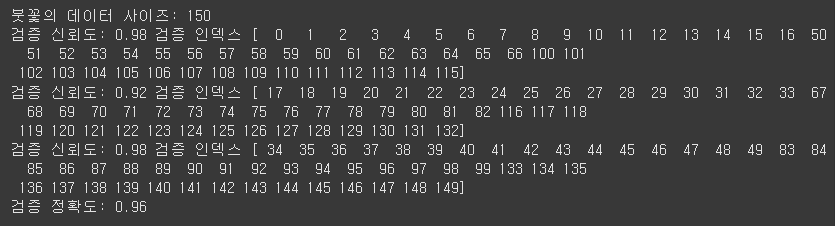
인덱스가 조금 더 불규칙해지면서 정확도를 올릴 수 있게 되었습니다.
pd의 value_counts()를 사용해보면 각 품종에서 33 33 34개씩으로 고루 가져온 것도 알 수 있습니다.
이렇게 일일이 분류하는 것은 근데 조금 귀찮습니다.
다행히 우리에겐 훌륭한 라이브러리가 있습니다.
cross_val_score()을 통하여 알아서 교차 검증을 시킬 수 있습니다.
scores = cross_val_score(dt_clf, iris_data, iris_label, scoring='accuracy', cv=4)
print("교차 검증별 정확도:", np.round(scores, 4))
print("평균 정확도:", np.round(np.mean(scores), 4))
cross_val_score(estimator, x, y, scoring, cv=fold 개수, ...)
esimator에 classifier(회귀일 때는 Regressor), x에 데이터, y에 레이블을 넘겨주면 검증을 자알 해줍니다.
'CS > AI' 카테고리의 다른 글
| [ML] K-NN (K-Nearest Neighbor) 이미지 분류 (0) | 2025.04.08 |
|---|---|
| [ML] Scikit-learn을 활용해서 캐글 데이터 분석하기! (0) | 2025.04.02 |
| [ML] Pandas 사용법 익히기 (0) | 2025.03.27 |
| sesame/csm-1b 오픈소스 공개, 환경 세팅 후 사용해보기 (0) | 2025.03.20 |
| [프롬프트 엔지니어링] CoT (Chain of Thought) 프롬프팅 (0) | 2024.12.31 |


